
modello di carosello LinkedIn analisi dei dati gratis
Ho analizzato 100 post
Un carosello di dati per LinkedIn: numeri in evidenza, un grafico a barre color senape, una scoperta per slide e una tabella riassuntiva.
- Piattaforma
- Dimensioni
- 1080 × 1350 (4:5)
- Slide
- 7
- Prezzo
- Gratis
Si apre nell'editor: descrivi il tuo argomento e l'IA riscrive ogni slide con questo design, oppure modificalo tu.

Cosa c'è nelle slide
- Slide 1
A 3-week spreadsheet, summarised
I analysed 100 LinkedIn posts that hit 1M views
Hooks, length, format, timing. Here is what the top 10% had in common.
- Slide 2
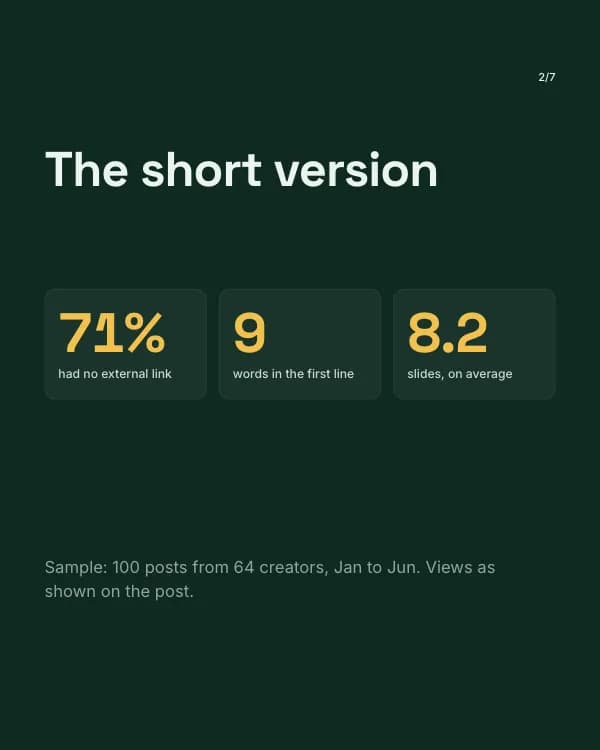
The short version
Sample: 100 posts from 64 creators, Jan to Jun. Views as shown on the post.
- Slide 3
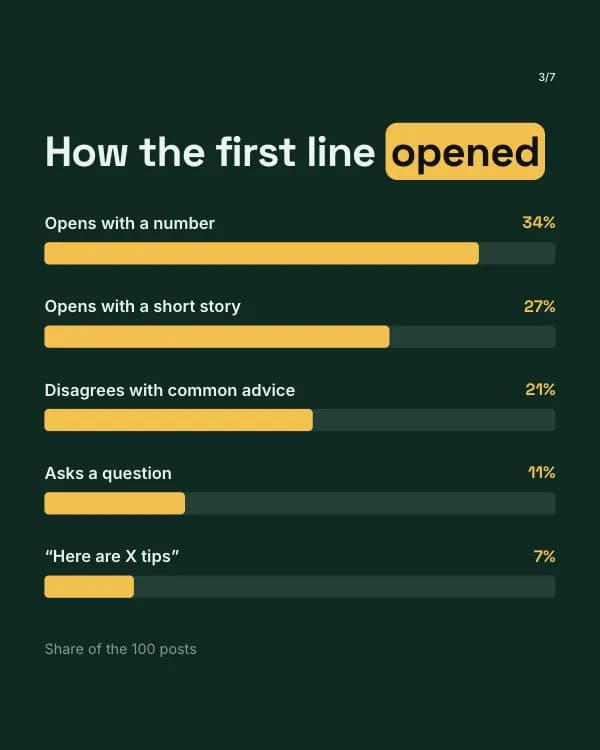
How the first line opened
Opens with a number
34%
Opens with a short story
- Slide 4
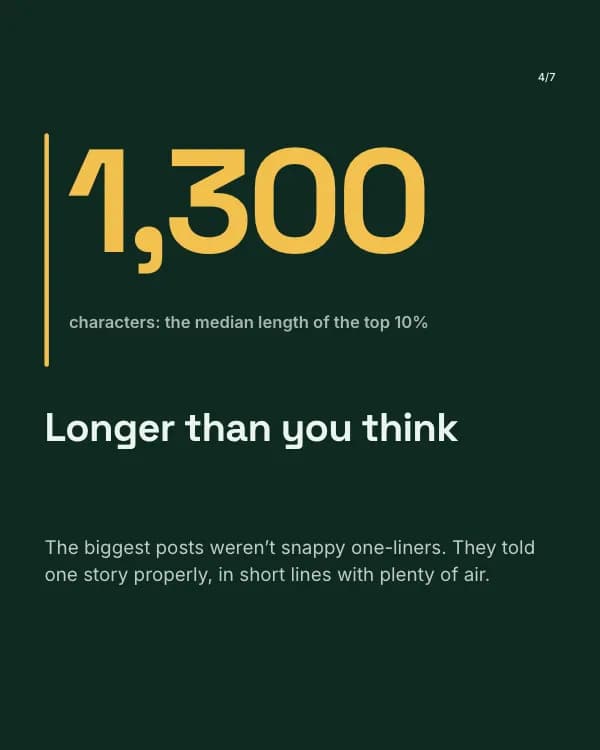
characters: the median length of the top 10%
Longer than you think
The biggest posts weren’t snappy one-liners. They told one story properly, in short lines with plenty of air.
- Slide 5
more comments when the post ended on a specific question
“Thoughts?” is not a question
The winners asked something only the reader could answer: “What was your first salary?” beats “Agree?” every time.
- Slide 6
Which format pulled its weight
- Slide 7
Want the full spreadsheet?
Comment “DATA” and I’ll send you all 100 posts, tagged by hook and format.
Come usare questo modello per LinkedIn
- Aprilo nell'editor con “Usa questo modello”. Niente da installare.
- Personalizzalo: scrivi il tuo argomento e lascia che l'IA riscriva ogni slide con questo design e foto abbinate, oppure cambia tu testi, foto e colori.
- Esporta in 1080 × 1350 (4:5) come PDF per un post documento su LinkedIn e pubblica.
Altri modelli di carosello per LinkedIn
Vedi tutti →
Matrice d’impatto
modello di carosello LinkedIn framework di prioritizzazione

Lezioni di anni
modello di carosello LinkedIn lezioni di carriera

Post salvati
modello di carosello LinkedIn card di citazioni

Report sulle assunzioni
modello di carosello LinkedIn dati sondaggio assunzioni