Kostenlose LinkedIn Daten-Insights Karussell-Vorlage
Ich habe 100 Posts analysiert
Ein Daten-Karussell für LinkedIn: Kennzahlen vorab, ein senfgelbes Balkendiagramm, eine Erkenntnis pro Slide und eine Übersichtstabelle.
- Plattform
- Größe
- 1080 × 1350 (4:5)
- Slides
- 7
- Preis
- Kostenlos
Öffnet sich im Editor: Beschreib dein Thema und die KI schreibt jede Slide in diesem Design neu – oder du bearbeitest sie selbst.

Das steht auf den Slides
- Slide 1
A 3-week spreadsheet, summarised
I analysed 100 LinkedIn posts that hit 1M views
Hooks, length, format, timing. Here is what the top 10% had in common.
- Slide 2
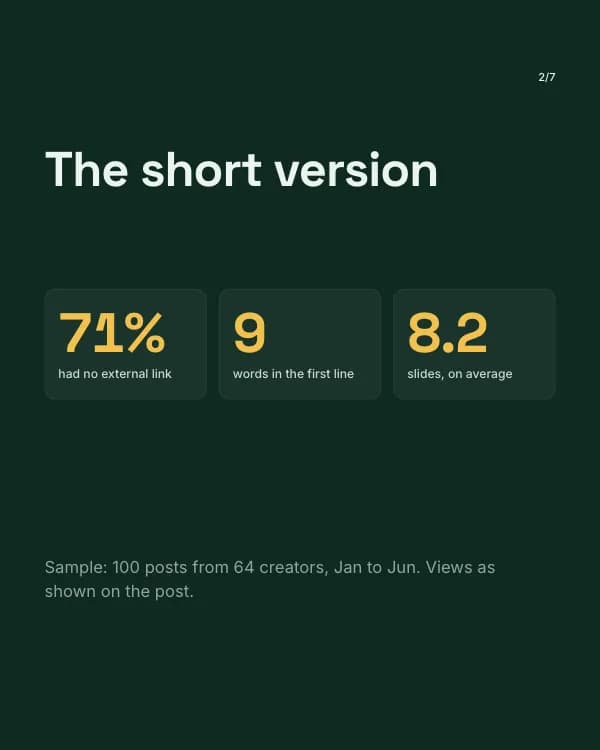
The short version
Sample: 100 posts from 64 creators, Jan to Jun. Views as shown on the post.
- Slide 3
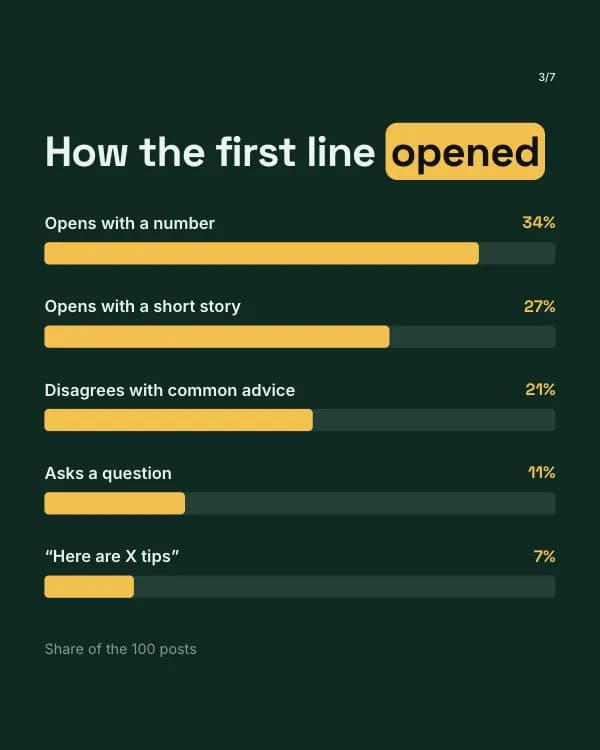
How the first line opened
Opens with a number
34%
Opens with a short story
- Slide 4
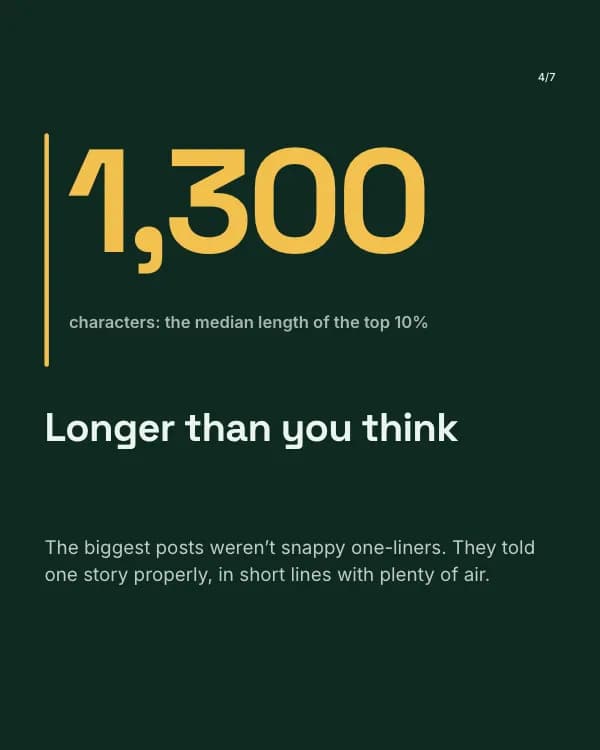
characters: the median length of the top 10%
Longer than you think
The biggest posts weren’t snappy one-liners. They told one story properly, in short lines with plenty of air.
- Slide 5
more comments when the post ended on a specific question
“Thoughts?” is not a question
The winners asked something only the reader could answer: “What was your first salary?” beats “Agree?” every time.
- Slide 6
Which format pulled its weight
- Slide 7
Want the full spreadsheet?
Comment “DATA” and I’ll send you all 100 posts, tagged by hook and format.
So nutzt du diese LinkedIn Vorlage
- Öffne sie im Editor mit „Vorlage nutzen“. Ohne Installation.
- Mach sie zu deiner: Gib dein Thema ein und lass die KI jede Slide in diesem Design mit passenden Fotos neu schreiben – oder ändere Texte, Fotos und Farben selbst.
- Exportiere in 1080 × 1350 (4:5) als PDF für einen LinkedIn-Dokument-Post und poste.